

Death Cross Stock Market Meaning: What It Signals and How to Respond

Death cross stock market meaning refers to a technical chart signal that happens when a shorter-term moving average drops below a longer-term moving average, often interpreted as a sign of weakening momentum.
Contents
31 sections
-
What the death cross stock market meaning is (in plain English)
-
Why people pay attention to it
-
Death cross vs. golden cross
-
How the death cross is calculated
-
What a death cross can and cannot tell you
-
What it can tell you
-
What it cannot tell you
-
Why false signals happen (whipsaws)
-
Practical ways to use a death cross without overreacting
-
Decision rules you can apply
-
A simple risk check checklist
-
Timeline-based guidance: under 1 year, 1 to 3 years, 3 to 7 years, 7+ years
-
Under 1 year
-
1 to 3 years
-
3 to 7 years
-
7+ years
-
What this looks like with real numbers: three sample allocations
-
Scenario 1: $10,000 saved for a goal in 10 months
-
Scenario 2: $50,000 with a 3 to 5 year home down payment target
-
Scenario 3: $200,000 long-term portfolio (10+ years), moderate risk
-
How a death cross can affect borrowing and personal finances
-
1) If you might need a loan soon
-
2) If you are carrying high-interest debt
-
3) If you are tempted to use margin or leverage
-
Common questions about the death cross
-
Does a death cross mean a crash is coming?
-
Is the death cross more reliable on indexes or individual stocks?
-
What indicators do people pair with it?
-
A practical response plan (step-by-step)
-
Where to verify related money basics
-
Bottom line
You will most often hear it described as the 50-day moving average crossing below the 200-day moving average on a stock index like the S and P 500, Dow Jones Industrial Average, or Nasdaq. Traders watch it because it can confirm that a downtrend is becoming more established. Long-term investors should understand it too, not as a prediction, but as a risk signal that can inform how you size positions, rebalance, and plan cash needs.
What the death cross stock market meaning is (in plain English)
A moving average is a smoothed line of past prices. The 50-day moving average represents recent price action, while the 200-day moving average represents the longer-term trend. A death cross occurs when:
- The 50-day moving average falls below the 200-day moving average.
- This typically happens after prices have already been falling for a while.
In other words, the “death cross” is usually a confirmation signal, not an early warning. By the time it appears, the market may already be down meaningfully from a prior peak.
Why people pay attention to it
- Trend confirmation: It suggests the intermediate trend has weakened relative to the long-term trend.
- Behavioral impact: Because many market participants watch the same signal, it can influence trading decisions and headlines.
- Risk management trigger: Some investors use it as a rule to reduce risk, rebalance, or tighten loss limits.
Death cross vs. golden cross
The opposite signal is the golden cross, when the 50-day moving average rises above the 200-day moving average. That is often viewed as improving momentum.
| Signal | What happens | Common interpretation | Big limitation |
|---|---|---|---|
| Death cross | 50-day MA falls below 200-day MA | Downtrend may be strengthening | Often arrives late, after declines |
| Golden cross | 50-day MA rises above 200-day MA | Uptrend may be strengthening | Can whipsaw in choppy markets |
How the death cross is calculated
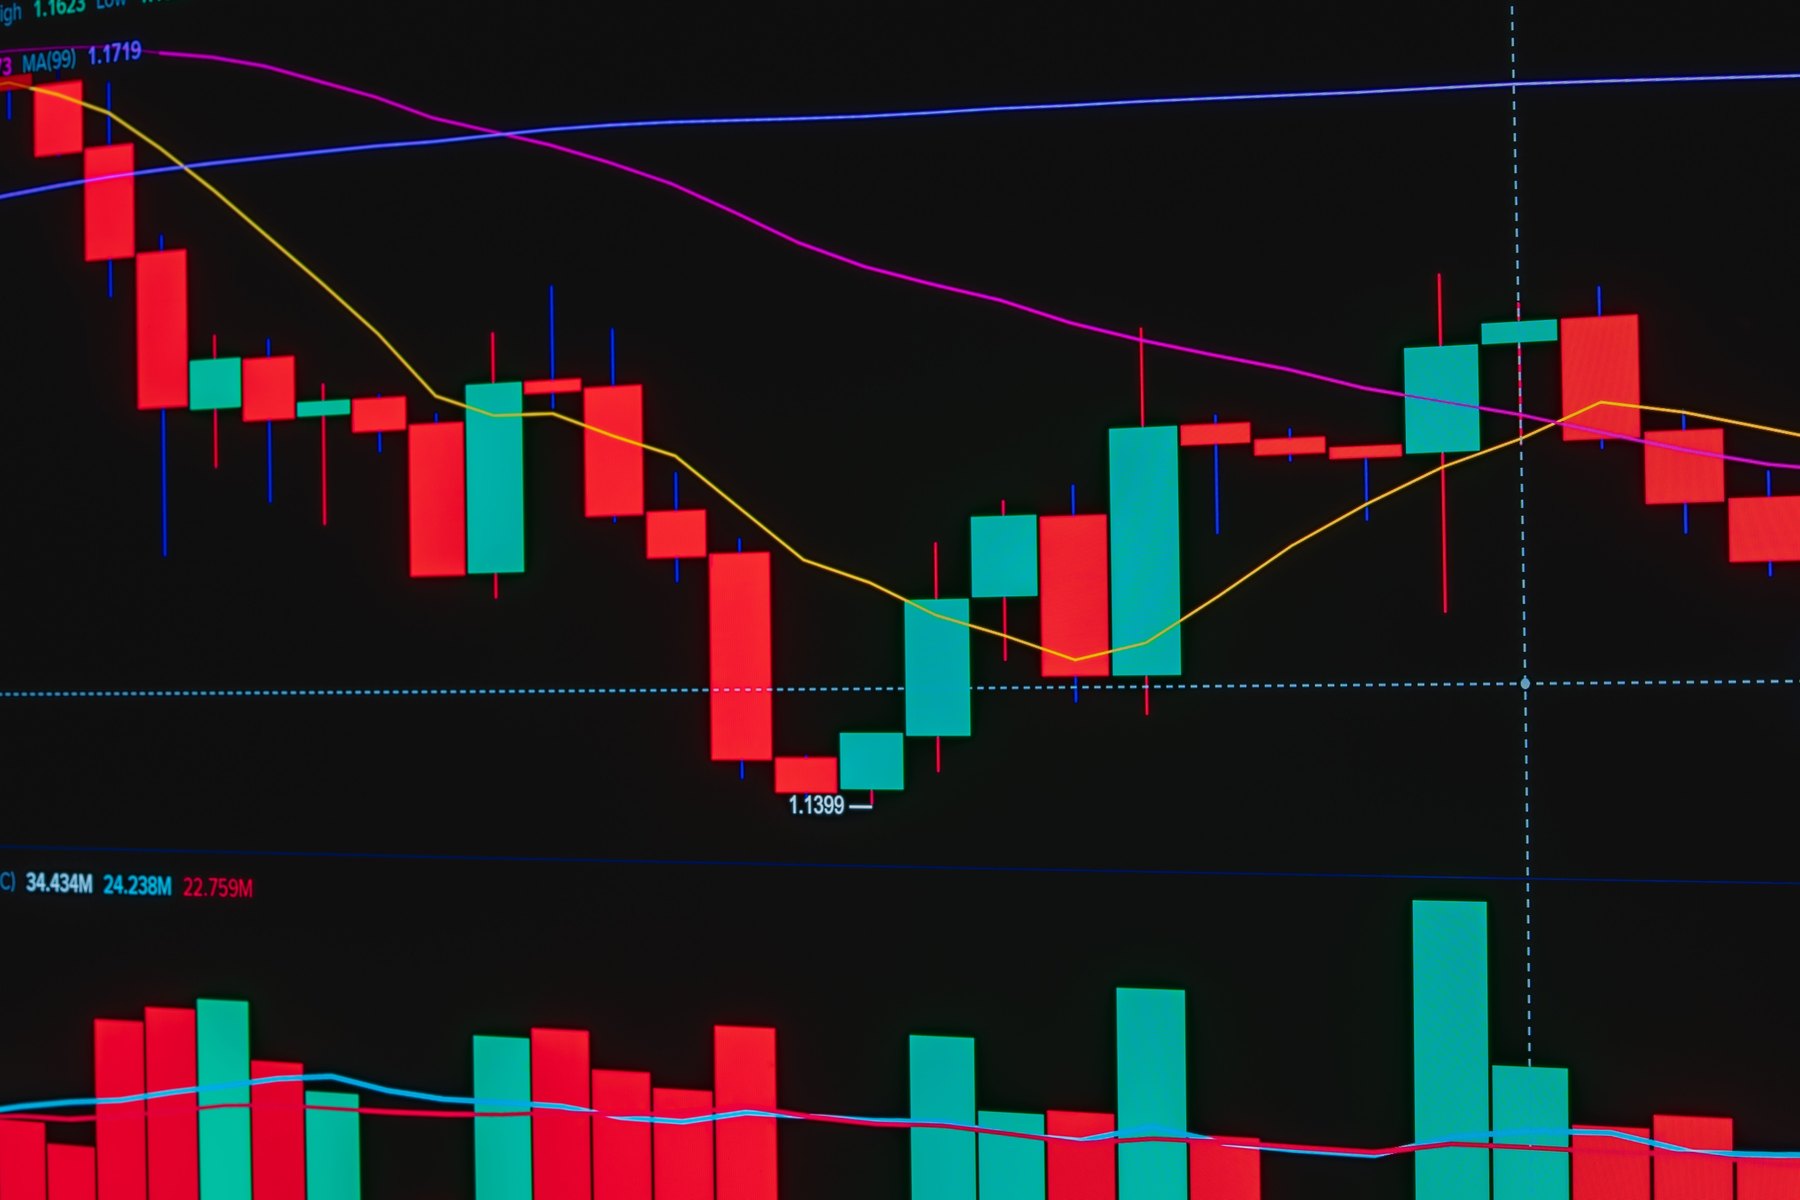
The “50-day” and “200-day” moving averages are typically simple moving averages (SMA), though some traders use exponential moving averages (EMA). The basic idea is the same: average the closing prices over a set number of trading days.
- 50-day SMA: average of the last 50 closing prices.
- 200-day SMA: average of the last 200 closing prices.
The death cross occurs on the day the 50-day line crosses below the 200-day line. Charting platforms like TradingView, Yahoo Finance, and many broker dashboards can display these indicators with a few clicks.
What a death cross can and cannot tell you
A death cross is best viewed as a trend and risk signal, not a guarantee of what happens next. Markets can keep falling after a death cross, but they can also rebound, especially if the signal occurs during a volatile, range-bound period.
What it can tell you
- Recent prices have weakened enough to pull the 50-day average below the 200-day average.
- Momentum has shifted from neutral or positive to negative on a medium-term basis.
- Risk of further drawdowns can be higher than during a strong uptrend.
What it cannot tell you
- Timing: It does not reliably tell you the best day to sell or buy.
- Magnitude: It does not tell you how far prices might fall or rise.
- Cause: It does not explain whether the move is driven by earnings, rates, geopolitics, or sentiment.
Why false signals happen (whipsaws)
In choppy markets, moving averages can cross back and forth. That can lead to “sell low, buy higher” behavior if you follow the signal mechanically. False signals are more common when:
- Volatility is high but the market is not trending strongly.
- Prices are mean-reverting around a long-term average.
- There are sharp, short-lived selloffs followed by fast rebounds.
Practical ways to use a death cross without overreacting
If you invest for long-term goals, the most useful approach is to treat the death cross as a prompt to review your plan, not as a command to exit everything.
Decision rules you can apply
- If you need the money soon: reduce exposure to volatile assets regardless of chart signals.
- If you are over your target stock allocation: rebalance back to your target rather than making an all-or-nothing bet.
- If you hold concentrated positions: consider position sizing rules, diversification, or defined exit points.
- If you are using margin or leverage: review margin requirements and your ability to meet a margin call in a downturn.
A simple risk check checklist
| Question | Why it matters | Action if “no” |
|---|---|---|
| Do you have an emergency fund (3 to 12 months of expenses)? | Prevents selling investments at a bad time | Build cash reserves before adding risk |
| Is your debt manageable (especially high APR credit cards)? | High-interest debt can outweigh market returns | Prioritize payoff or lower-cost repayment options |
| Are you diversified across sectors and asset types? | Concentration increases drawdown risk | Consider broad funds and rebalancing |
| Do you know your time horizon for this money? | Short horizons and stocks do not mix well | Match investments to timeline buckets |
| Could you handle a 20% to 40% drop without panic selling? | Behavior often drives outcomes | Reduce risk to a tolerable level |
Timeline-based guidance: under 1 year, 1 to 3 years, 3 to 7 years, 7+ years
Technical signals like a death cross matter less than your timeline. Use time as your primary decision rule.
Under 1 year
Money needed within a year is usually not a good fit for stocks, regardless of whether a death cross appears. Consider prioritizing liquidity and principal stability. If you are holding cash, verify your bank coverage and account ownership categories. The FDIC explains deposit insurance basics here: https://www.fdic.gov/.
1 to 3 years
For near-term goals, consider a conservative mix. A death cross can be a reminder to avoid stretching for returns with money you cannot afford to delay. If you do invest, keep volatility modest and plan for the possibility of needing to wait out a downturn.
3 to 7 years
This is a middle zone. You may be able to tolerate some stock exposure, but you still want a plan for what you will do if markets drop right before you need the funds. Rebalancing rules and a cash buffer can matter more than any single chart pattern.
7+ years
Long horizons can absorb multiple market cycles. A death cross may still be useful as a prompt to review diversification, contribution plans, and risk level, but many long-term investors focus on consistent investing and periodic rebalancing rather than tactical exits.
What this looks like with real numbers: three sample allocations
Below are examples of how someone might adjust their money management when a death cross raises concerns about volatility. These are not one-size-fits-all. Use them to sanity-check your own plan based on timeline, job stability, and debt.
Scenario 1: $10,000 saved for a goal in 10 months
- $8,500 in a high-yield savings account (check current APY and any withdrawal limits)
- $1,000 in short-term Treasury bills or a Treasury money market fund (check yield and settlement time)
- $500 in a broad stock index fund only if you can delay the goal if markets drop
Total: $10,000
Scenario 2: $50,000 with a 3 to 5 year home down payment target
- $25,000 in high-yield savings or money market
- $15,000 in short-to-intermediate bond funds or Treasuries (compare duration, credit risk, and fees)
- $10,000 in diversified stock index funds (accepting that this portion can be volatile)
Total: $50,000
Scenario 3: $200,000 long-term portfolio (10+ years), moderate risk
- $130,000 in diversified stock funds (US and international)
- $50,000 in bond funds or Treasuries (compare credit quality and interest-rate sensitivity)
- $20,000 in cash or cash equivalents for flexibility and rebalancing
Total: $200,000
How a death cross can affect borrowing and personal finances
Even though a death cross is a market indicator, it can connect to everyday money decisions. When markets fall, households sometimes face tighter budgets, job uncertainty, or higher stress around debt. Here are practical ways to link the signal to your financial plan.
1) If you might need a loan soon
If you are planning a mortgage, auto loan, or personal loan in the next 6 to 18 months, market volatility is a reminder to keep your cash cushion strong and your credit profile clean. Focus on:
- Paying bills on time
- Keeping credit utilization lower (many people aim under 30%, and lower can be better)
- Avoiding new debt you do not need
- Comparing APR, fees, and repayment terms across multiple lenders
2) If you are carrying high-interest debt
When markets are shaky, paying down high APR debt can be a reliable way to reduce financial risk. If you are considering a balance transfer card or a debt consolidation loan, compare:
- Intro APR period and transfer fees (for balance transfers)
- Loan APR range, origination fees, and term length (for consolidation loans)
- Total interest cost over the full repayment period
- Whether the payment fits your budget with room for surprises
3) If you are tempted to use margin or leverage
A death cross environment can coincide with higher volatility. Leverage can amplify losses and create forced selling. If you are using margin, know your broker’s maintenance margin rules and keep extra liquidity available.
Common questions about the death cross
Does a death cross mean a crash is coming?
No. It can appear before extended downturns, but it can also appear near a bottom or during a messy sideways period. It is a backward-looking trend signal, not a guarantee of future performance.
Is the death cross more reliable on indexes or individual stocks?
Many investors consider it more meaningful on broad indexes because single stocks can be driven by company-specific news. Even on indexes, it can still whipsaw.
What indicators do people pair with it?
Some traders look at trading volume, support and resistance levels, relative strength index (RSI), or whether price is also below the 200-day moving average. Long-term investors often pair it with rebalancing bands and cash-flow needs rather than more indicators.
A practical response plan (step-by-step)
- Confirm your timeline: label money as under 1 year, 1 to 3 years, 3 to 7 years, or 7+ years.
- Check cash reserves: aim for 3 to 12 months of expenses depending on job stability and household needs.
- Rebalance to targets: if stocks grew too large in your mix before the downturn, bring them back to target. If stocks fell and you are still within your risk tolerance, rebalancing may mean buying, not selling.
- Reduce fragile debt: prioritize high APR balances and consider refinancing only if the total cost and terms improve your situation.
- Set rules before headlines: decide in advance what would make you change course (job loss, goal date moved up, debt payment stress), not just a chart pattern.
Where to verify related money basics
If market stress pushes you to review your broader financial foundation, these sources can help:
- FDIC deposit insurance overview: https://www.fdic.gov/
- Consumer protection and financial products guidance (CFPB): https://www.consumerfinance.gov/
- Free credit reports (AnnualCreditReport.com): https://www.annualcreditreport.com/
Bottom line
The death cross stock market meaning is simple: it is a moving-average crossover that suggests weakening momentum. Its best use for most people is not predicting the next market move, but prompting a clear review of time horizon, cash needs, diversification, and debt. If you respond with a rules-based plan instead of a headline-driven reaction, the signal becomes a tool for risk management rather than a source of panic.


